To make the most of your sponsorship investments, focus on metrics that show real impact, like audience engagement, revenue growth, and customer loyalty. Here’s the key takeaway:
- Set SMART goals: Goals should be Specific, Measurable, Achievable, Relevant, and Time-bound.
- Track four metric categories: Exposure (impressions, reach), Engagement (social activity, traffic), Conversions (promo codes, sales), and Business Impact (ROI, market share).
- Use data effectively: Pre-event forms, real-time tools like RFID badges, and post-event reporting are critical for gathering insights.
- ROI benchmarks: Aim for a 4:1 return on investment; anything above 5:1 is outstanding.
- Tailor metrics by sponsorship level: Entry-level sponsors focus on visibility, while top-tier sponsors prioritize direct business results.
Pro Tip: Combine data from multiple sources – broadcast, social media, and in-person events – for a full view of your sponsorship’s performance.
The bottom line? Metrics drive better decisions, ensuring your sponsorship dollars work harder and deliver tangible results.
How to Calculate the ROI of Sponsorships
sbb-itb-161ccc1
Main Categories of Sponsorship Metrics
Sponsorship metrics are grouped into four main categories: exposure, engagement, conversion, and business impact. Each category focuses on a specific aspect of measuring how sponsorships perform, from visibility to long-term financial returns.
Exposure Metrics
These metrics focus on how visible your brand is and how far its reach extends. Key indicators include:
- Total impressions: The number of times your brand is seen.
- Audience reach: How many people across TV and social platforms are exposed to your sponsorship.
- Media Exposure Value (MEV): A financial estimate of the value gained from earned media coverage.
Engagement Metrics
Engagement metrics look at how actively audiences interact with your brand. These include:
- Social media activity: Likes, shares, and comments that reflect how audiences are responding to your sponsorship.
- Website traffic spikes: Increases in visits during events or campaigns.
- QR code scans: Participation at activation booths or other on-site activities.
- Net Promoter Score (NPS): A measure of how likely audiences are to recommend your brand, indicating overall brand affinity.
Conversion Metrics
Conversion metrics tie sponsorship activities directly to measurable business outcomes, such as:
- Unique promo codes: Tracking sales or leads generated from specific sponsorship campaigns.
- UTM-tagged landing pages: Monitoring web traffic and conversions tied to sponsorship efforts.
- Sales from activations: Direct revenue linked to sponsorship-related events or promotions.
These metrics focus on short-term results, like generating leads and driving revenue.
Business Impact Metrics
This category evaluates the long-term value of sponsorships. Examples include:
- Return on Sponsorship Investment (ROSI): A calculation of the financial return generated by sponsorship efforts.
- Customer Lifetime Value (CLV): The total revenue a customer is expected to bring over their relationship with your brand.
- Market share growth: Measuring how sponsorships contribute to expanding your presence in the market.
Given that research highlights inefficiencies in 88% of sponsorships and an average 68% miscalculation in ROI across the industry, accurate measurement of these metrics is essential for ensuring sustainable growth and maximizing returns.
Setting Baselines and SMART Goals
Before you can measure the success of a sponsorship, you need to establish clear baselines. These serve as your starting point – the metrics you evaluate before the sponsorship begins. Without them, it’s impossible to gauge whether your sponsorship efforts are making an impact. To set baselines, track metrics like audience reach, brand sentiment, and market share prior to launching your campaign. Once these are in place, you can move on to setting actionable goals.
That’s where the SMART framework comes in. This method ensures your goals are well-defined and actionable. Each goal should be:
- Specific: For example, aim to increase brand preference among 18-24-year-olds.
- Measurable: Set targets like achieving a 3X ROI or gaining 1,000 new leads.
- Achievable: Be realistic – perhaps scaling to three social platforms instead of five based on your team’s capacity.
- Relevant: Align your goals with broader company objectives, such as positioning your brand as an innovator.
- Time-bound: Set deadlines, like reaching milestones by the end of the 2026 season.
"Sponsorship measurement is like a scoreboard. Every sport has a different scoreboard, designed to reflect what matters most to that game." – Jake Lenz, Director of Marketing and Sales Strategy, MVPIndex
Once you’ve defined baselines and SMART goals, they become the foundation for measuring and analyzing your sponsorship’s impact. Identify KPIs that align directly with these goals. For instance, if your focus is on awareness, track metrics like media coverage and logo placements. If you’re targeting sales, monitor revenue and customer acquisition numbers. Use daily pacing to optimize underperforming assets while the partnership is still active. Real-time analytics are invaluable for making these adjustments on the fly.
Prioritize metrics that directly affect your bottom line – such as brand preference, sales growth, and Customer Lifetime Value – over less meaningful ones like social media impressions. By establishing baselines and SMART goals before signing any sponsorship deal, you create a clear, measurable roadmap for success.
Data Collection Methods for Sponsorship Metrics
To effectively measure sponsorship success, collecting accurate data is essential. This process hinges on three key phases: before the event, during the event, and after it concludes. Each phase plays a critical role in ensuring that the sponsorship’s impact is properly evaluated.
Pre-Event Data Collection
Data collection starts well before the event kicks off. The first step is to establish a clear definition of what constitutes a qualified lead. This could be anyone from a prospect matching your Ideal Customer Profile to someone with purchasing authority or even attendees who schedule follow-up meetings. Without this clarity, you risk ending up with contacts that provide little value.
Pre-event intent forms are a powerful tool for capturing buying signals. These forms, separate from standard registration, include options like demo sign-ups or meeting requests. On average, each form garners 91 submissions, yet many events underutilize this strategy. Additionally, map out how you’ll track each activation, whether it’s a workshop, dinner, or booth experience, so you can monitor the effectiveness of every touchpoint.
If you’re serious about measuring impact, consider using a treatment versus control group. This allows you to compare attendees exposed to your sponsorship with those who weren’t, giving you a clearer picture of how your sponsorship influences brand perception and behavior. Between 2025 and 2026, as more teams began planning their data collection strategies in advance, the percentage of organizers struggling to measure event ROI dropped from 70% to 40%.
Digital Analytics Platforms
During the event, real-time tracking tools provide valuable insights into attendee behavior. Platforms like Bizzabo and Klik use RFID or NFC smart badges to monitor attendee movement, booth dwell time, and session attendance. These systems integrate directly with your CRM, streamlining data collection and ensuring leads stay warm. In 2026, 30% of sponsors identified smart badges as their top method for generating high-quality leads.
Social media tracking has also become more sophisticated. Tools like Zoomph use AI to analyze logo visibility, clarity, and duration across broadcasts and social media posts. MVPIndex adds another layer by assessing brand sentiment – whether mentions are positive, negative, or neutral – which is vital for long-term brand equity. Native analytics from platforms like Instagram, TikTok, and X (Twitter) help track engagement rates, follower growth, and the performance of campaign-specific hashtags.
For broadcast measurement, advanced tools use ACR (Automatic Content Recognition) data from millions of households and devices to analyze exposure minute by minute. Additionally, platforms like Optimy and wehave integrate CRM data with sponsorship workflows, making it easier to track lead generation, pipeline influence, and overall ROI.
Post-Event Reporting
After the event, the focus shifts to compiling and analyzing the data. Use a five-layer measurement framework to structure your report: Reach (impressions), Engagement (dwell time), Intent (meeting requests), Pipeline (opportunities created), and Revenue (closed deals).
Final ROI calculations should be delayed by 60–90 days to account for the time it takes leads to move through the sales funnel. Multi-touch attribution models – such as first-touch, last-touch, or linear – can help demonstrate how sponsorship interactions contributed to sales. To avoid errors, ensure all leads are properly tagged in your CRM.
Quantitative data is crucial, but qualitative insights add depth. Gather attendee feedback and booth observations to contextualize the numbers. Be open about what didn’t work – whether it was poor booth placement or scheduling issues – as this transparency builds trust with sponsors and guides future improvements. End your report with actionable recommendations for the next event, highlighting adjustments and untapped opportunities.
"Event sponsor ROI is the measurable business impact a sponsor generates from event participation, including qualified leads, pipeline created, revenue influenced, and engagement quality tracked through onsite data and CRM integration." – Jodi Whitehead, Event Data & Analytics, Bizzabo
Sponsorship Tier Structures and Measurement Expectations
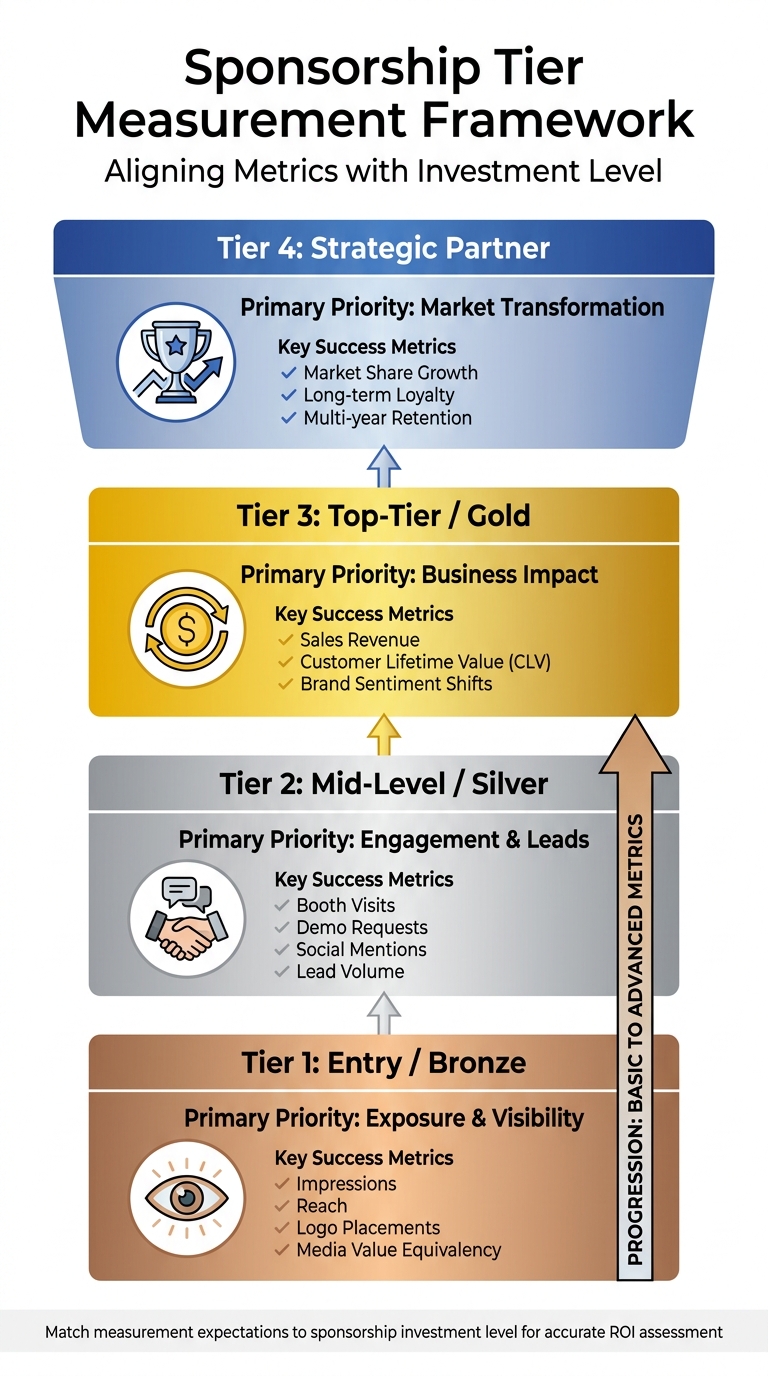
Sponsorship Tier Measurement Framework: Metrics by Investment Level
Expanding on data collection strategies, understanding sponsorship tiers is key to refining how success is measured. Metrics should align with the level of investment – what works for a lower-tier sponsor won’t apply to a high-level title sponsor. Your measurement framework needs to reflect these differences.
For lower-tier sponsors, the focus is on exposure and visibility. When sponsors are paying for logo placements or basic recognition, success revolves around metrics like impressions, reach, and media value equivalency. Mid-tier sponsors prioritize engagement and lead generation, so metrics such as booth traffic, demo requests, and social media interactions take center stage. At the top-tier level, sponsors expect proof of business impact – think direct sales revenue, Customer Lifetime Value (CLV), and changes in brand sentiment. Matching these metrics to the investment level ensures that measurement aligns with the sponsor’s goals.
While sponsorship packages are sold based on rights, the real return on investment (ROI) comes from activating those rights – through campaigns, experiences, and content that bring the sponsorship to life. As Jason Smith from SponsorCX explains:
"The rights give you permission to be in the room. Activation is how you make an impression once you’re there".
To make these activations successful, allocate equal budgets for activation and rights fees (a 1:1 ratio). This balance is essential for achieving measurable outcomes.
Tier-Based Measurement Framework
The focus of measurement evolves with each sponsorship tier:
| Sponsorship Tier | Primary Priority | Key Success Metrics |
|---|---|---|
| Entry / Bronze | Exposure & Visibility | Impressions, Reach, Logo Placements, Media Value Equivalency |
| Mid-Level / Silver | Engagement & Leads | Booth Visits, Demo Requests, Social Mentions, Lead Volume |
| Top-Tier / Gold | Business Impact | Sales Revenue, Customer Lifetime Value (CLV), Brand Sentiment Shifts |
| Strategic Partner | Market Transformation | Market Share Growth, Long-term Loyalty, Multi-year Retention |
When negotiating sponsorship contracts, include tier-specific KPIs that complement your pre-set baselines and SMART goals. This ensures accountability and guarantees access to the data you need for effective measurement. It’s worth noting that only 19% of sponsorship professionals feel confident in measuring business value return, and a staggering 65% of sponsors don’t measure ROI at all. Setting clear expectations early can help avoid these pitfalls.
Calculating ROI and Media Value Equivalency
Once you’ve established your baseline and SMART goals, it’s time to measure how well your sponsorship is performing. Calculating Return on Sponsorship Investment (ROSI) and Media Value Equivalency (MVE) provides a clear picture of your financial and media returns.
ROSI evaluates the financial return by dividing your net profit – factoring in direct sales, increased brand value, and customer lifetime value (CLV) – by your total costs, which include sponsorship fees and activation expenses. For example, a 4:1 ROI indicates you’re generating $4 of value for every $1 spent. In general, a 3:1 ratio is considered solid, while anything above 5:1 is exceptional.
MVE, on the other hand, helps quantify the value of brand exposure. It estimates what the same exposure would cost if you purchased it as traditional advertising. This involves tracking your brand’s visibility across platforms like TV, streaming services, and social media. To calculate, you apply platform-specific rates, such as CPM for social media or the cost of a 30-second ad spot. However, raw impression counts aren’t enough – adjustments for factors like clarity, prominence, size, and placement help refine the true value of the exposure. These adjustments ensure you’re capturing a more accurate representation of what your sponsorship delivers.
For deeper insights into sponsorship impact, use tracking identifiers like UTM parameters, promo codes, and dedicated landing pages. These tools make it easier to attribute revenue directly to sponsorship activities. For instance, in March 2026, a betting company tracked its $2 million sponsorship and discovered it generated $5.5 million in revenue from registered fans. Without these identifiers, connecting revenue to specific sponsorship efforts would have been nearly impossible.
To further refine your analysis, implement multi-touch attribution models. Approaches like first-touch, last-touch, or linear attribution can connect sponsorship interactions to revenue more effectively. For an even sharper understanding, consider running a treatment versus control analysis. By comparing the behavior of a group exposed to the sponsorship with one that wasn’t, you can isolate its true impact on customer behavior and brand perception.
Lastly, calculating CLV ensures you capture the long-term value of customers acquired through sponsorships. This step is crucial for avoiding an undervaluation of sponsorships that drive loyal, high-value customers over time. Despite its importance, only 40% of sponsors prioritize partner research data. By setting baselines early and tracking the entire customer journey – from first interaction to repeat purchases – you’ll be better equipped to refine and optimize future sponsorship strategies.
Competitor Benchmarking for Sponsorship Strategies
Using solid internal metrics as a foundation, competitor benchmarking can take your sponsorship strategy to the next level. The goal here isn’t to copy what others are doing but to pinpoint gaps and uncover opportunities to improve your own approach. By analyzing competitors’ strengths, you can also identify areas they might be overlooking – giving you an edge. A good starting point? Look at their media exposure value (MEV). MEV estimates how much it would cost to achieve similar advertising exposure through sponsorships. This gives you a baseline to compare your reach and ensure your investment delivers the value you’re expecting.
Social listening tools are also invaluable for this process. These tools help you track mentions, audience sentiment, and engagement trends. For example, monitoring conversations during a major sporting event can show whether a competitor’s sponsorship is boosting positive brand perception or just generating surface-level buzz. But don’t stop at digital engagement – pay attention to how competitors allocate their resources.
Keep an eye out for signs of increased sponsorship investment. For instance, if a competitor starts hiring more people for partnership marketing roles or launches a new product with a hefty marketing budget, it could signal a ramp-up in sponsorship activity. These moves can provide timely clues about when and where to act.
Also, analyze the types of partnerships your competitors are forming and how often they activate them. Take Red Bull, for example – they consistently back extreme sports, which reinforces their bold brand identity. On the other hand, Emirates focuses heavily on football sponsorships to maximize global reach. Spotting these patterns can help you position your own sponsorships more effectively. When combined with detailed analysis, these observations can lead to valuable insights into how your competitors are performing.
Finally, consider applying a treatment versus control analysis to measure the true impact of your campaigns. Use a 4:1 ROI benchmark as a guide to evaluate success.
Advanced Analytics for Sponsorship Evaluation
Attribution Modeling
Multi-touch attribution is an effective way to measure sponsorship impact, especially since most prospects don’t convert after just one interaction. For example, someone might see your brand at an event, engage with a social media post later, and then take action down the line.
To track this journey, set up unique UTM parameters for each sponsorship touchpoint – like QR codes at your booth, social media links, email signatures, and landing pages. This creates a clear trail in your CRM, linking every interaction back to its sponsorship source. Different attribution models can then offer unique insights: first-touch attribution highlights the initial interaction, last-touch focuses on what pushed the conversion, and linear attribution spreads credit evenly across all touchpoints.
Another approach is using treatment versus control analysis to isolate the impact of your sponsorship. Just keep in mind that leads take time to move through the sales funnel, so it’s best to wait 60 to 90 days after an event before calculating your final ROI.
By combining these attribution strategies with data from multiple sources, you can get a clearer picture of how your sponsorships are performing.
Multi-Source Data Integration
Integrating data from broadcast, social media, and in-venue activations provides a complete view of your sponsorship performance. This approach moves beyond surface-level metrics like impressions to track meaningful outcomes such as audience behavior, direct sales, and Customer Lifetime Value (CLV) .
For example, in April 2025, a North American retailer combined TV viewership data with local sales figures to demonstrate that its MLB sponsorship delivered returns on par with other marketing channels. Around the same time, a global financial services company used econometric modeling to evaluate a motorsport sponsorship. After simulations showed insufficient ROI, they decided to cancel the deal.
Modern tools also use Automatic Content Recognition data from over 32 million households and 40 million devices to analyze broadcast exposure minute by minute. However, as Benjamin Kennady, Cloud Solutions Architect at Striim, points out:
"The capability of a company to make the best decisions is partly dictated by its data pipeline. The more accurate and timely the data pipelines are set up, the more quickly and accurately an organisation can make the right decisions".
To truly understand the impact of a sponsorship, combine quantitative data (like sales figures) with qualitative insights (such as sentiment analysis and surveys). This dual approach helps measure both immediate financial returns and long-term brand perception, offering a more complete view of Return on Sponsorship Investment (ROSI) .
Renewal Rate Benchmarks
Once you’ve analyzed the impact of your sponsorships, tracking renewal rates can help you assess their ongoing value. Renewal rates are a strong indicator of partnership success, and AI-powered predictive analytics can improve sponsorship forecasting by up to 85%. This makes it easier to identify which partnerships to keep. Multiply your qualified leads by their Average Lead Value to estimate revenue potential before deals close.
To better predict financial outcomes, monitor your pipeline value at 30-, 60-, and 90-day intervals. Use this data to guide renewal decisions – whether that means continuing the partnership, renegotiating terms, or reallocating your budget to better-performing opportunities. With the sports sponsorship market expected to hit $89 billion by 2027, making informed decisions is more important than ever.
As mentioned earlier, a 4:1 ROI benchmark is often used to evaluate sponsorship returns, meaning four dollars of value for every dollar spent. In B2B settings, an ROI above 3:1 is solid, while anything above 5:1 is exceptional. But remember, your data must be accurate. Many organizations struggle with poor data quality, which can lead to flawed decisions. Properly preparing your data is a must before diving into advanced analytics.
Conclusion
Tracking the success of sponsorships boils down to focusing on the metrics that truly matter. With the global sponsorship market surpassing $90 billion annually and the sports sponsorship sector expected to reach $89 billion by 2027, having a solid measurement strategy is more important than ever.
Start by setting SMART goals – specific, measurable, achievable, relevant, and time-bound – that align with your brand’s objectives. Whether your aim is to boost brand awareness in a certain market or to generate qualified leads, your measurement approach should be tailored to your needs. As Jake Lenz and Brandon Nutting from MVPIndex explain:
"Measurement doesn’t have to be complicated. You don’t need a PhD in data analytics to start tracking meaningful metrics… The goal is progress, not perfection."
Once your goals are clear, focus on metrics that show real progress. Combine quantitative data like sales figures and lead generation with qualitative insights such as customer loyalty and brand sentiment. Multi-touch attribution can help you see how sponsorship activities influence the buyer journey over time, while ROI should only be calculated after leads have had time to mature. Industry benchmarks suggest a sponsorship ROI of 4:1 is standard, with anything above 5:1 considered exceptional.
For budgeting, follow the 1:1 or 2:1 activation rule – spend as much or twice as much on activation as you do on rights fees. Rights provide access, but activation is what turns visibility into results. To get a full picture of your sponsorship’s performance, integrate data from all channels – broadcast, social media, and on-site events.
FAQs
Which sponsorship metrics matter most for my goals?
When it comes to sponsorship metrics, what matters most will depend on your specific goals:
- For brand visibility: Keep an eye on impressions, media reach, and sponsorship recall to gauge how much attention your brand is getting.
- For brand perception: Metrics like brand lift and sentiment analysis can show how people feel about your brand and whether opinions are shifting.
- For business outcomes: Focus on tracking sales, ROI, and the overall revenue impact to see if the sponsorship is driving tangible results.
Other useful tools include competitor benchmarking and studying audience demographics. These can help fine-tune your approach and better measure how well your efforts are working. The key is to align your metrics with your goals so you can clearly measure success.
How do I set baselines before a sponsorship starts?
To establish a solid starting point, focus on identifying key metrics such as audience reach, media exposure value, brand interaction, and sales performance. Begin by measuring the current levels of these metrics to create a baseline. Collect data on how your target audience interacts with your brand, their exposure to it, and their overall perception before the sponsorship starts. This will serve as a benchmark, helping you assess the sponsorship’s impact more effectively once it’s underway.
What’s the best way to attribute revenue to sponsorships?
To accurately tie revenue to sponsorships, multi-touch attribution models are your best bet. These models track the entire customer journey, giving credit to multiple touchpoints along the way. By tagging leads with campaign details and using advanced analytics tools, you can effectively distribute credit across different channels.
Additionally, full-funnel attribution models offer a complete picture – measuring everything from brand awareness to actual sales. This approach ensures precise revenue tracking and helps back up sponsorship investments with solid, data-backed insights.