
Luxury rental demand in the U.S. is still strong, but it does not follow the same pattern as the rest of the vacation rental market. If I had to boil the article down to a few points, it’s this: luxury guests are spending more per trip, large homes are seeing faster demand growth, and early weak pacing does not always mean you should cut rates.
Here’s the short version:
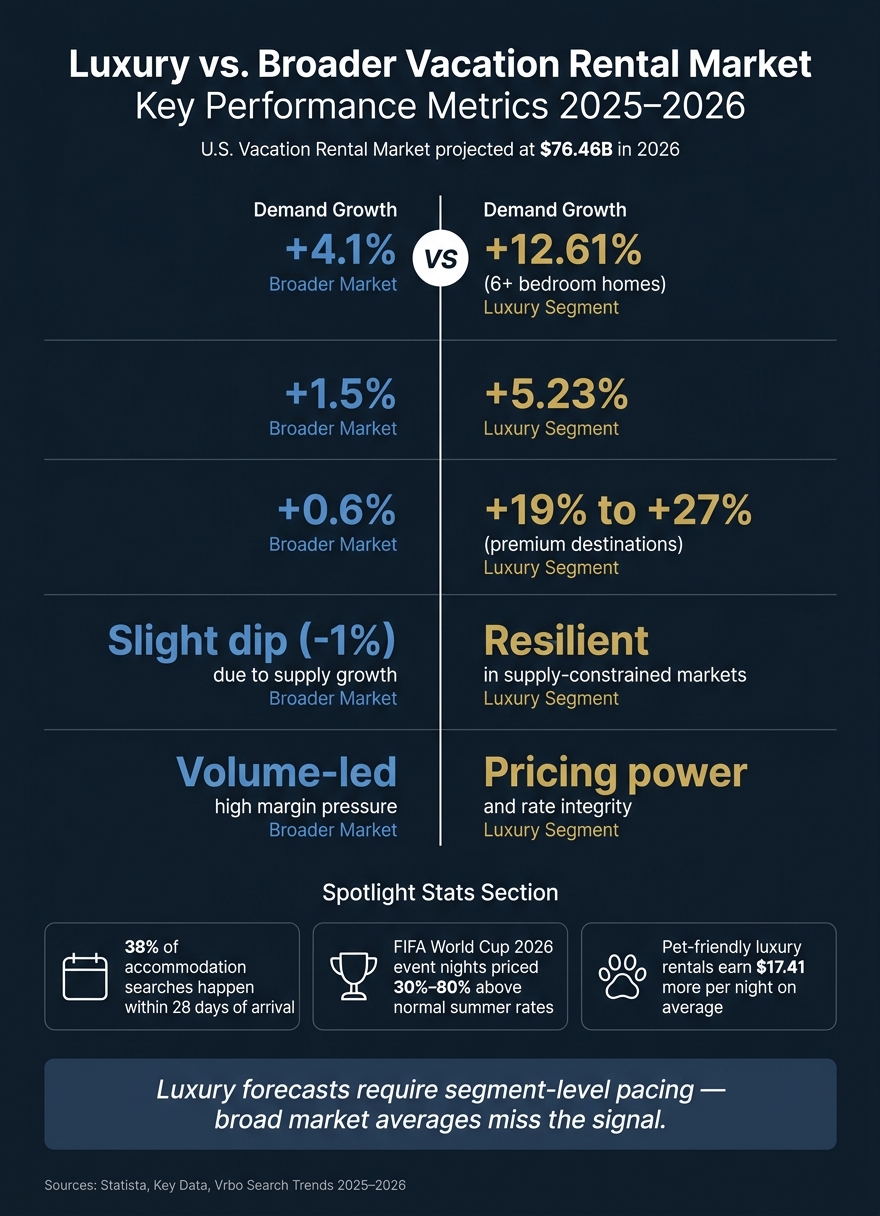
- Luxury is outpacing the broader market. The broader U.S. vacation rental market is set to reach $76.46 billion in 2026, but demand for 6+ bedroom homes grew 12.61%, far above the broader 4.1% growth pace.
- Rate strength is holding. Luxury-tier ADR grew 5.2% year over year, while budget-tier ADR slipped 0.3%.
- Booking windows are shorter. Average lead time fell to 60 days, and 38% of accommodation searches now happen within 28 days of arrival.
- Event demand still books early. Big events like the FIFA World Cup 2026 are pushing rates 30% to 80% above normal summer pricing in some cases.
- Supply-constrained markets are leading. Places like Jackson Hole, WY and Big Sky, MT are holding high ADR because inventory stays tight.
- Amenities and service matter for price strength. Features like private pools, EV charging, pet-friendly policies, and strong concierge service support higher nightly rates.
- Forecasting works better when luxury is tracked on its own. Broad averages can blur what’s happening in premium homes, group stays, and event-led travel.
If I’m looking at this from an owner or revenue manager’s point of view, the takeaway is simple: watch luxury pacing, event calendars, search shifts, stay-length patterns, and amenity premiums together.
A few revenue moves stand out right away:
- Hold rate instead of discounting too early
- Use 3- to 4-night minimum stays where demand supports it
- Keep gap-fill rules open for shoulder nights
- Price event dates early and protect rate floors
- Build forecasts around property type, market, and guest segment, not just old occupancy averages
Luxury vs. Broader Vacation Rental Market: Key Metrics 2025–2026
The Ultimate Guide to Financial Forecasting for Vacation Rentals
sbb-itb-161ccc1
Quick Comparison
| Area | Broader Market | Luxury Segment |
|---|---|---|
| Demand growth | +4.1% | +12.61% for 6+ bedroom homes |
| ADR trend | +1.5% | +5.23% |
| Occupancy pattern | Softer due to supply growth | More stable in tight-supply markets |
| Booking behavior | More short-lead demand | Split between short-lead leisure and long-lead event/group stays |
| Main pricing driver | Volume | Rate discipline and premium positioning |
So before getting into the detail, I’d frame it like this: luxury demand is still there, but the signals are more split than before. That means better forecasts come from reading late pickup, event demand, market-level supply pressure, and premium-home performance together – not from using one broad market view for every property.
The Data Landscape: Market Growth, Guest Segments, and Property Patterns
Market Size, Growth Rates, and U.S. Demand Drivers
The U.S. vacation rental market is on track to hit $76.46 billion in 2026, up from $72.00 billion in 2025. But the headline number only tells part of the story. The more useful read is this: luxury demand is outpacing the market as a whole.
Broader demand is expected to slow to 4.1% in 2026, down from 4.7% the year before. At the same time, bookings for homes with 6+ bedrooms climbed 12.61%. That gap matters because it shows up where operators feel it most: forward occupancy and ADR, not just top-line market growth.
What’s behind it? A split travel market. Higher-income travelers are still spending on premium trips, while younger travelers keep leaning toward rentals for group stays and event-led travel. Travelers booking high-end trips have increased their budgets by 17%. And vacation rentals are the pick for 62% of Gen Z and 60% of Millennials, with younger affluent groups helping drive luxury travel for weddings, concerts, and sporting events.
Which Luxury Properties and Locations Are Performing Best
Luxury performance isn’t rising evenly across every market. Some places are pulling ahead.
Jackson Hole, WY leads U.S. summer 2026 forward occupancy at 45.5%, with an ADR of $589. Big Sky, MT is close on rate, posting an ADR of $594. On the coast, Cape Cod saw RevPAR jump 27%, while San Diego posted 21% growth. These markets have one thing in common: tight supply. When inventory stays limited, pricing tends to hold up better.
Property type matters too. In luxury rentals, size is a strong signal. Bookings for 6+ bedroom estates grew 12.61%, which points to strong group demand. Guests also expect privacy as a starting point now, not a bonus. Features like separate entrances and keyless access are baseline for many luxury stays.
Then there are the extras that support higher nightly rates:
- Private pools
- EV charging
- Home theaters
- Pet-friendly policies
Those features strengthen the ADR story. Pet-friendly luxury rentals, for example, earn an average of $17.41 more per night and can bring in 12% to 90% more than similar non-pet-friendly listings in top-tier markets. For pricing and forecast models, that’s not small change.
Luxury vs. Broader Vacation Rental Metrics: A Comparison
Luxury is beating the broader market on the numbers that matter most for forecasting. Side by side, the gap is hard to miss.
| Metric | Broader U.S. Market | Luxury / Upscale Segment |
|---|---|---|
| ADR Growth | +1.5% | +5.23% |
| Demand Growth | +4.1% | +12.61% (6+ bedroom homes) |
| RevPAR Growth | +0.6% | +19% to +27% (premium destinations) |
| Occupancy Trend | Slight dip (-1%) due to supply | Resilient in supply-constrained markets |
| Revenue Driver | Volume-led; high margin pressure | Pricing power and rate integrity |
This is why luxury forecasting can’t lean on broad-market averages. A market growing at 4.1% behaves very differently from a segment where large homes are growing demand at 12.61% and premium destinations are posting 19% to 27% RevPAR growth. That’s the gap revenue teams need to price around.
The Strongest Demand Signals in Recent Studies
Booking Windows, Seasonality, and Event-Driven Demand
After market size, the next forecasting question is timing: when does luxury demand turn into booked nights?
The answer has shifted. Booking windows are getting shorter. Average U.S. lead time dropped to 60 days in 2025, down 11.4% year over year. And the pattern gets even clearer from search behavior: 38% of all accommodation searches now happen within 28 days of arrival. That matters because late booking activity can make early pacing look soft, even when final occupancy ends up holding steady.
Seasonality is moving too, and that can throw off anyone still leaning on old summer patterns. Vrbo search data shows March 2026 demand jumped 74% year over year, while July and August searches dropped 45% and 58%. In plain English: summer is no longer the safe default it used to be.
Event demand is even more direct. Dynamic pricing tied to event calendars can lift revenue by 20% to 40%. And for major events like the FIFA World Cup 2026, match-date nights are pricing at 30% to 80% above normal summer rates.
There’s also a split in booking behavior that operators can’t ignore. Broad-market demand is compressing into shorter lead times, while ultra-luxury event stays are still booking 2–3 years ahead. That’s why one pacing model won’t cut it. Short-lead demand and long-lead event demand need their own pricing logic.
Amenity and Service Data That Drive Premium Bookings
Timing matters, but so does the product itself. In luxury rentals, amenity mix can change both booking odds and rate strength.
Privacy-first design, 24/7 concierge responsiveness, and turnkey setup are now close to baseline guest expectations. The properties holding rate strength when occupancy softens are usually the ones that treat operations as part of the product, not as an extra.
Pricing behavior backs that up. Properties using frequent dynamic pricing see up to 30% higher occupancy than properties sticking with static rates. On top of that, luxury apartments posted a 119.6% increase in booking volume and a 169% increase in revenue value year over year. That points to something pretty simple: amenity-heavy, professionally managed inventory tends to produce steadier and easier-to-read demand signals.
Demand Signals and Their Forecast Effects
| Demand Signal | Effect on Key Metrics | Practical Forecasting Application |
|---|---|---|
| Booking Window Compression | Lower lead time; higher last-minute occupancy | Move discount triggers to 30 days out; don’t overreact to weak early pacing |
| Event Calendars (World Cup, Olympics) | 20%–40% revenue lift; rate spikes on event dates | Set rate floors 60–90 days out; use event-detection tools |
| 3–4 Night Minimum Stay | Up to 34% more revenue than 1-night minimums | Use this as the calendar baseline in non-peak periods |
| Long-Lead/Long-Stay Bookings | 31.9% cancellation rate for 30+ night stays booked 2–3 months out | Don’t count on this revenue too early; keep backup pricing live |
| Luxury Amenity Stack | Measurable ADR premium at the luxury tier | Build management and service costs into RevPAR models before locking decisions |
| Supply Constraints (Zoning/Geography) | Supply limits slow inventory growth and extend pricing power | Push rates earlier; constrained markets often show demand signals months in advance |
Forecasting Methods and Revenue Decisions That Matter Most
Forecast Models and Metrics Used in Current Research
Demand signals only help if the forecast model can read them well. In luxury rentals, one model usually isn’t enough. The best results come from combining methods. Research shows that historical-only forecasting gets weaker as supply grows, which is why forward-looking data now plays a much bigger role.
Time-series models use past occupancy and seasonal averages to build a baseline. They work well when patterns stay steady. But when booking behavior changes, they can fall behind.
Machine learning models bring in real-time pacing, search volume, and market occupancy. That makes them a better fit for daily pricing and sharp demand swings.
Hybrid models blend macro data like CPI and supply growth with property-level data. They tend to be the best fit for longer-range calls, especially around investment plans and staffing.
Current research keeps a close eye on ADR, RevPAR, and pacing. In Q1 2026, forward ADR was pacing +4% year over year even though early occupancy was softer. That’s a useful signal: rate strength can hold up even when early booking volume looks shaky.
So the point isn’t just to build a forecast. The point is to use that output in pricing decisions.
How Forecasts Shape Pricing, Stay Rules, and Amenity Investment
These signals should shape pricing, stay rules, and amenity spending. One of the biggest operating mistakes is simple: seeing weak early pacing and cutting rates too soon. Don’t discount early just because forward pacing looks soft.
Minimum-stay rules matter too. Right now, the sweet spot is a 3- to 4-night minimum. Research shows that 4-bedroom homes with a 4-night minimum earn 41% more than homes with a 1-night minimum. That’s a big gap.
At the same time, you don’t want to lock the calendar too tightly. If pacing points to gap-fill demand on shoulder nights, it makes sense to loosen minimums on mid-week nights and pick up that demand.
Wellness features and premium services can also help support higher ADR floors.
The next move is to apply these rules market by market instead of pushing the same forecast across every property.
Model and Strategy Comparison Tables
| Model Type | Key Inputs | Best Used For | Key Metrics |
|---|---|---|---|
| Time-Series (Statistical) | Historical occupancy, seasonal averages | Baseline seasonal rate-setting | ADR, RevPAR |
| Machine Learning (Predictive) | Real-time pacing, search volume, market occupancy | Daily pricing, event detection | Pacing, lead time |
| Hybrid Models | Macroeconomic data (CPI, supply growth) + property data | Long-term investment and staffing decisions | RevPAR, long-term revenue |
| Revenue Action | Expected Effect on ADR | Expected Effect on Occupancy | Luxury Brand Impact |
|---|---|---|---|
| Rate protection (late booking pickup + event-based price floors) | Maintains or increases | Weak early, stronger late | Positive |
| 3–4 night minimum stay | Neutral | Increases revenue capture +34% to +41% | Positive (exclusivity) |
| Dynamic pricing (high frequency) | Increases | Up to +30% occupancy gain | Neutral if rate floors hold |
| Gap-fill rules (shoulder nights) | Neutral | Increases mid-week utilization | Neutral |
Conclusion: Using Data Trends to Build More Accurate Luxury Demand Forecasts
Recent studies show that luxury demand doesn’t move like the rest of the rental market. High-income travelers are still spending on premium stays, even as budget-focused markets cool off. That split changes how operators should think about pacing, pricing, and booking windows. For luxury rentals, broad market averages can miss the mark. Segment-level pacing gives a much better read on what’s coming next. And those patterns only matter if they shape pricing, stay rules, and amenity spending.
In supply-constrained premium markets, ADR and RevPAR keep beating broader market benchmarks. That backs up a pretty simple idea: forecast models built around premium pacing, event calendars, and guest-segment behavior tend to do better than models based only on past averages. The edge comes from putting a few signals together: pacing, event calendars, search trends, and guest segments.
The practical takeaway is simple: turn those signals into day-to-day revenue decisions.
Key Takeaways for Luxury Rental Operators
Track the signals that fit your market and guest mix. National averages are often too blunt for luxury properties, especially when booking windows run longer.
- Hold rate discipline and act on event pricing early. As Melanie Brown, VP Data Analytics and Insights at Key Data, put it: "Operators are no longer reacting to soft forward pacing by discounting early. They are pricing for late pickup and protecting rate integrity." Bookings for World Cup event nights were up 16% year over year as of June 2026. That’s the kind of signal you want to watch early, then use to adjust pricing and stay rules before demand tightens.
- Review market data often and protect service quality. Right now, 32% of property managers review market data weekly. That tells you this isn’t a once-a-month task anymore. Premium service, privacy, and concierge responsiveness aren’t add-ons in luxury rentals. They’re part of the product, and they help support premium pricing and repeat bookings.
Luxury forecasts get better when operators protect rate, read demand early, and act on signals tied to their own market.
FAQs
Why does luxury demand behave differently from the broader rental market?
Luxury rental demand works differently. It’s driven less by need and more by wealth insulation, lifestyle choices, and tight supply.
That sets it apart from the broader market. High-net-worth guests often keep spending on privacy, security, and exclusive experiences even when rates go up or markets get shaky.
This part of the market is also more rate-first and less price-sensitive. During major events, that becomes even clearer. Families and institutions often care more about certainty, private space, and full service than the final cost.
When should owners avoid discounting luxury rentals?
Owners should avoid big price cuts during shoulder seasons. In many cases, added value works better. Think curated packages or offers like Stay 4, Pay 3. Those deals can attract bookings without cheapening the brand.
The same goes for competitive, high-supply markets. Aggressive discounting can spark a race to the bottom and still fail to bring in more revenue. For luxury properties, holding the line on pricing matters even more. That’s why rate floors are critical for protecting rate integrity.
Which data signals matter most for forecasting luxury demand?
Focus on three core signals:
- Historical booking trends from the past two to three years, checked daily to spot dates that tend to perform well
- Market pacing for future bookings compared with past patterns, along with a 12-month event calendar
- Key metrics: occupancy, ADR, and RevPAR
When you track these every day, you can adjust rates in real time and get more revenue from each stay.